The LMS Mobile Test Plant in Action
O S Nock - The Engineer 20 October 1950
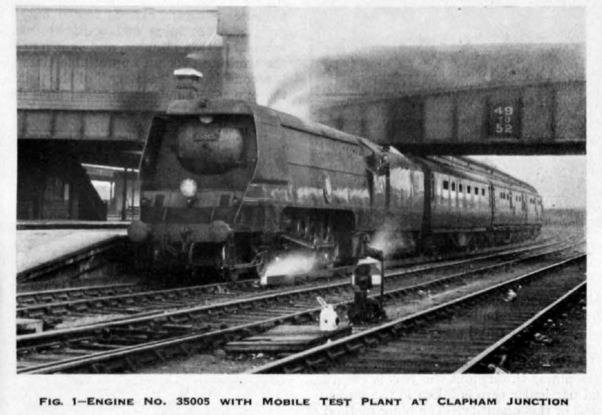
Figure 1 – Engine No:35005 with the Mobile Test Plant at Clapham Junction
|
The gradual evolution of a truly scientific method of conducting road tests on steam locomotives has been spread over more than fifty years. From early indicator trials such as those of W M Smith on the North-Eastern Railway in 1898, on which The Engineer commented so outspokenly, to the mobile testing plant devised by the London Midland & Scottish Railway is a long and sometimes roundabout road; and when the time came for this remarkable modern plant to be put into service, and its unique features were described by Dr H I Andrews in a paper read before the Institution of Mechanical Engineers in April 1948, there were, to judge from the discussion upon that paper, some who felt then that there was little to be gained by a perpetuation of the practice of road testing, when such modern laboratory facilities would shortly be available in the new stationary testing plant at Rugby. It is not the purpose of the present article, however, to enter into discussion upon the relative merits of stationary and road testing – road testing, that is, under the constant-speed conditions made possible by the LMS mobile testing plant. Each has its own vital part to play in the development of British locomotive practice. The mobile testing plant is still being used at the moment to assess the overall road performance of certain locomotives in varying conditions of operation and with different grades of fuel. By the courtesy of Mr R. A. Riddles, member of the Railway Executive responsible for mechanical and electrical engineering, I was privileged to travel on the plant during some trials on the Southern Region between London and Salisbury. The particular test witnessed was one of a series carried out on the ‘Merchant Navy’ class ‘Pacific’ engine No:35005 ‘Canadian Pacific’ which had been fitted experimentally with a mechanical stoker. One can, of course, appreciate the extreme interest attaching to the results of such a series of trials; at the moment, however, I am concerned, not with the particular locomotive under test nor with any discussion of possible results, but rather with the actual practice of testing as conducted in the mobile plant. About the principles of road testing at constant speed I will add only that one can secure many of the advantages of stationary plant testing, with the advantage that there is no need to attempt to reproduce in a laboratory the aerodynamic conditions arising from the passage of the locomotive through the atmosphere, as has been done in some stationary plants. On a road test there is the complication of wind resistance; but apparatus is available for taking continuous records of relative wind speed and its direction throughout any particular run, and from such records, and the results of researches into the air resistance of trains, the effect of wind upon the train can be assessed. |
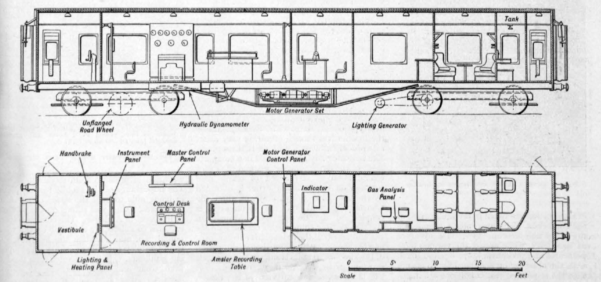
Figure 2 The layout of the dynamometer car
| In the trials carried out between London and Salisbury the constant speed stipulated was 50 mile/h and with the co-operation of the traffic department a path was arranged following the Atlantic Coast Express, whereby an unchecked run during the constant speed period was secured. The traffic arrangements were interesting, as showing how the work of the mobile testing plant is dovetailed into the ordinary service at midweek. The train left from one of the Windsor line platforms at Clapham Junction, followed the ‘Riverside’ line as far as Point Pleasant Junction, and from there took the spur to the line from Putney Bridge to Wimbledon, which is used jointly by trains of Southern Region and London Transport Executive. The constant speed test on the outward run extended roughly from Esher to Andover, a distance of 52 miles. Beyond the latter station a reduction of speed had to be made for permanent way work in progress; after the restricted length had been passed over the remainder of the distance to Salisbury was used for the carrying out of certain indicator trials at speeds other than 50 mile/h. Similarly on the return journey the Salisbury – Andover stretch was again used for indicating and a constant speed test followed. Since the original description of the plant the new dynamometer car has been completed, and on the return journeys in question the ‘train’ consisted of this car and two of the mobile test units. On the day I travelled the weather was fine and calm, though I understand that throughout these particular trials no continuous measurements of relative wind speed and direction were taken. Figure 1 shows the locomotive and test plant about to leave Clapham Junction. |
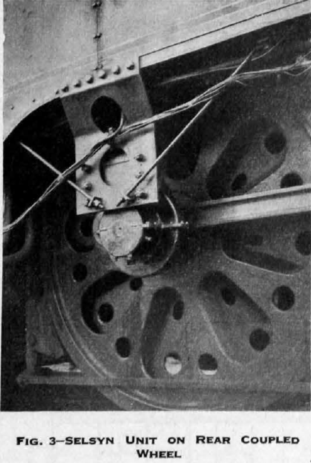
Figure 3 – Selsyn unit on rear coupled wheel
| The layout of the dynamometer car is shown in Fig 2. Although a system of telephones extends throughout the plant and the engineer at the control desk can at any time converse with ‘key’ members of the testing staff, it is convenient to have the instrument panel and the Amsler recording table adjacent to the control desk, since the test as a whole depends upon the functions of these three units. On the instrument panel is shown the data concerning the steaming of the locomotive; boiler, steam chest and exhaust pressure; steam temperatures in the boiler, leaving the superheater, and exhaust; while temperatures of the products of combustion are taken in the firebox and in the smokebox. The instruments themselves are of the non-recording type. The observer at this panel, while noting the various temperatures and pressures, keeps in close touch with the observer on the footplate to ensure that the stipulated test conditions are maintained. On this particular run a constant steam chest pressure of 200 psi was required, in conjunction with a 20 per cent cut-off on the outward run and 30 percent on the return. The behaviour of the locomotive on coal of very inferior quality was being examined, and the stipulated steam chest pressure of 200 psi was no doubt chosen to admit of a constant value being maintained in the face of probable fluctuation in boiler pressure, due to the fuel, below the rated maximum of 280 psi. |
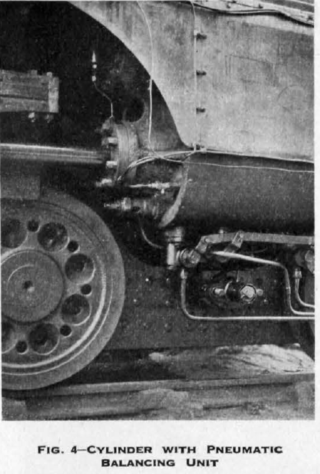
Figure 4 - Cylinder with pneumatic balancing unit
| The maintenance of a constant indicated horsepower throughout the test is essential and particular care is taken in the measurement of this quantity. The older method of fitting ordinary steam indicators adjacent to the cylinders and taking of diagrams by observers riding in a specially constructed shelter on the front of the locomotive obviously had its own disadvantages, quite apart from the chances of error inherent in the method itself, and the practical impossibility of erecting shelters at the front end of streamlined or air-smoothed locomotives. In the mobile testing plant a Dobbie-McInnes Farnborough (Royal Aircraft Establishment) type of indicator is used in which the drum is continuously revolving in exact synchronism with the revolving of the locomotive’s driving wheels; thus the errors due to inertia that are inherent in the oscillating type of indicator hitherto used in steam practice are eliminated. It will be appreciated, however, that the diagram is drawn on a base representing the crank angle instead of the piston stroke, as in the oscillating type of indicator. The attachments to the locomotive, though requiring very accurate pre-adjustment, are simple in themselves. The indicator itself is mounted in a compartment of the dynamometer car, and the exact reproduction of the speed on the indicator drum is obtained by the use of two Selsyn units, of which the transmitting unit on the locomotive is coupled to the driving axle through an Oldham flexible coupling, to compensate for the movement of the axle relative to the locomotive frame. It is claimed that the action of the two Selsyn units is such as to reproduce rotation with and accuracy of ±1 deg. Fig 3 shows a close up view of the Selsyn unit mounted adjacent to the rear coupled wheel of the ‘Merchant Navy’ class locomotive on test. The Selsyn itself, and the flexible coupling and drive mechanism, are housed in a specially constructed case which can readily be fitted to any engine. |
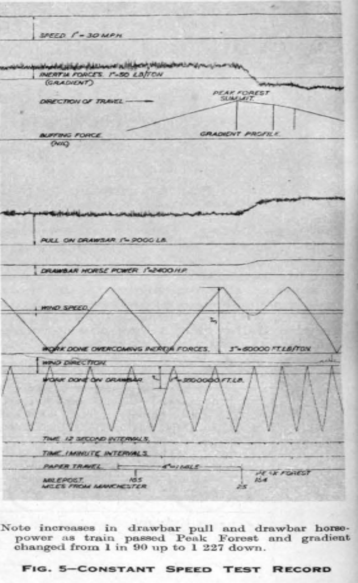
Figure 5- Constant speed test record
| The pressure component of the indicator diagram
is recorded by means of a pneumatic balancing unit, one of which is
fitted to each end of all cylinders of the locomotive, as shown in Fig
4. A balancing air pressure, which can be pre-set and maintained at any
value within the range of pressure likely to be reached in the cylinders
of a steam locomotive, is conveyed to the cylinder elements by piping. When the steam pressure in the cylinder reaches the same value as this pre-set air pressure, a contact is made that pinpoints the pressure on the indicator diagram. The operator in charge of indicating varies the air pressure – in the particular example under review from atmosphere to 200 psi – and gradually the complete indicator diagram can be traced out. The process of obtaining such a diagram usually takes about six minutes, and as it represents the working over an appreciable time there is a considerable ‘scatter’ of the points on the expansion and compression lines due to variation in pressure from stroke to stroke. The importance of the mobile testing plant, in being able to hold the speed at some required test value, was shown on the section of line west of Andover. The constant speed test was completed by this time on the westbound run, and although the line descends from Grately towards Salisbury on steepening gradient, this final stretch was used to take some indicator diagrams at slower speeds. Near Porton, for example, the braking units were loaded up to hold the engine at no more than 20 mile/h on a gradient of 1 in 169 down, while cards were taken at 15% cut-off, and the usual 200psi steam chest pressure. |
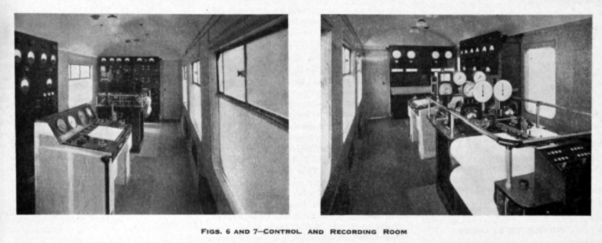
Figure 6 - Inside the dynamometer car
| On indicator trials run in former days the
downhill sections of line were of little value; on stretches like those
from Peak Forest to Rowsley, or Blea Moor down to Settle Junction, to
mention two well-known gradients on the Midland line, the locomotives
under test would be working under very light steam, if not actually
coasting. But with the mobile testing plant full use can be made of
almost every mile of the line. On the trip I accompanied indicator
diagrams were still being taken as we approached Tunnel Junction only a
mile short of Salisbury, and I understand that on one of the up journeys
some diagrams at moderate speed were taken between Wimbledon and East
Putney. Naturally, in such cases of deliberately slow running care has
to be taken to avoid causing delays to following trains, and on the
westbound trip after Grately the genial old southern region guard was
called into consultation by the senior members of the testing staff to
confirm that the ‘road was ours’ sufficiently long to make the records
desired. The taking of indicator diagrams at precisely maintained road speeds is, however, only one outcome of the central feature of the mobile test plant – the electrical braking units and the method of automatically controlling the speed. The principles involve were described in complete detail in Dr Andrews’s paper read before the Institution of Mechanical Engineers in April 1948, and reported in THE ENGINEER, April 23, 30 and May 7 1948. In actual practice it was fascinating to watch the precise manner in which the engineer at the control desk was able to build up to the stipulated test condition, working, of course, in close collaboration with the observer on the footplate |
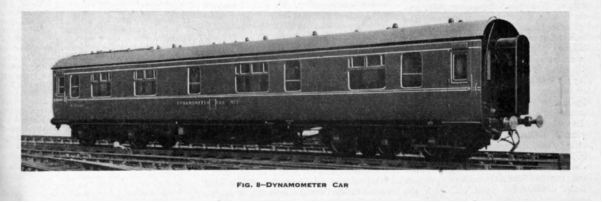
Figure 7 - No:3 Dynamometer Car
| As the steam chest pressure was increased so, by
hand control, was the excitation current on the mobile test unit braking
generators increased by adjusting the ‘hand control’ potentiometer to
regulate the feed to grid-controlled rectifiers, which in turn supply
direct current to the field windings of the excited generators. While
the change-over switch remains in the ‘hand-control’ position the second
potentiometer, for automatic control, is adjusted until the voltage from
an independent fixed reference supply is approximately equal to the
voltage from the tachometer generator driven off the un-flanged road
wheel of the dynamometer car. This latter voltage, which is kept at a
constant value by two stabilisers, is, under automatic control, opposed
by the voltage of the tachometer generator, and the difference in
potential between the two is utilised to increase or decrease the
excitation current in the brake generators. To obtain high sensitivity,
the voltage representing the error between the specified test speed and
the actual is amplified; but it is equally necessary to reduce that
sensitivity to a minimum when switching over from hand to automatic
control. The facility of increasing or decreasing the sensitivity is
provided by a third potentiometer, which at the time of switching over
from hand to automatic control is placed in the position of least
sensitivity, so as to reduce to a minimum any surge or wheel slip
arising from a difference between specified and actual speed that could
scarcely be detected from the relative voltmeters on the master control
panel. As an actual example of working up to required test conditions,
on the eastbound journey we left Andover Station, where a stop had been
made to take water, at 4.20½ pm; the switch-over to automatic control
took place at 4.28 pm, by which time the locomotive working had been
stabilised at 50mile/h, 30% cut-off and 200psi steam chest pressure. The
drawbar pull, acceleration and gradient are directly recorded, but
through a system of spherical integrators the speed, draw-bar
horsepower, work done on the draw-bar and also against acceleration and
gradient are recorded graphically on the chart. Facilities are also
provided on the table for recording continuously the relative wind
velocity and the relative wind direction, though these quantities were
not measured in the trials conducted on the Southern Region engine
No:35005. The rapid response of the automatic control to changes in conditions could be seen on the master control panel in the exciting currents fed to the mobile test unit brake generators, and in the validation of draw-bar horsepower. Changes in gradient are fairly frequent during this run, and usually the corresponding change in draw-bar horsepower was complete in about five seconds. In Fig 5 is reproduced a typical extract from a dynamometer record. |
O S Nock - The Engineer - 20 October 1950